Back to download page
Features:
- Runs SQL queries and display the spatial results on a map.
- Attributes are shown when hovering on geometry features.
- Supports both Geographic and Planar geometry types.
- LineStrings
using geographic geometry are densified to show the correct path of the
line (note: line-segments on polygons are not densified!)
- Results can be saved as ESRI ShapeFile format (experimental).
- Change rendering style based on attributes, allowing thematic maps.
- Custom background maps.
- Right-click features to view them as GML or Well-Known Text, or to copy the attributes.
FAQ
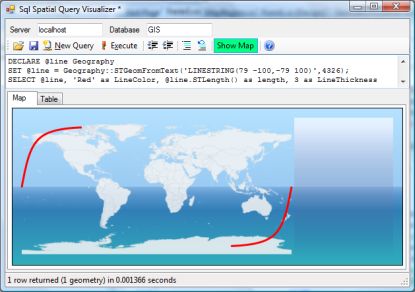 Why are my lines curved when using the Geography type?
If you use the geography type or a geometry type with an SRID between
4000 and 4999, lines will be shown as curves following a great circle.
This doesn't mean that the lines are not straight - Just that
projecting a sphere onto a flat screen distorts straight lines into
curves (see more here). If they cross the dateline, they will also be cut in two (see illustration to the right).
Note that this curvature is not applied to polygons, so you might see some discrepancies on large polygons with few vertices.
Why does polygons spanning across the dateline look weird when using the Geography type?
Because the viewer doesn't support splitting polygons at the dateline like it does with lines.
Controlling display output
Controlling color
Control the output colors by creating FillColor and LineColor columns.
Examples:
Green fill, no outline:
SELECT *, 'Green' AS FillColor, 'Transparent' as LineColor FROM countries
Hex-value based fill color, default outline (black):
SELECT *, '#FF49A9CC' AS FillColor FROM countries
If your color is integral, it will map the color to a rainbow-like scale using values from 0..16777216.
If you color is floating point, it will map the color to a rainbow-like scale using values from 0..1.
Values outside this range will be clipped.
Example:
If the color value cannot be parsed it will use default colors (Black for outline, White for fill).
Changing line symbology
Control the thickness of lines/outlines by creating a LineThickness column. The value specifies the width in pixels.
Example:
SELECT *, 'Blue' as LineColor, 3 as LineThickness FROM Rivers
Changing the Background Map
If you use a geometry type with an SRID between 4000 and 4999 (which is
assumed to contain longitude/latitude coordinate pairs) or a Geography
type, a rough world map is shown as background. You can disable this in
View menu. You can also specify your own world map to use. The image
has to be a map in the "Plate Carrée" projection containing the entire world. Width should be twice the size of the height.
You can get a good satellite image as background from here: http://visibleearth.nasa.gov/view_rec.php?id=7105 (I've had good success with the 5400x2700 JPEG image, but beware that larger images could cause problems).
Export result as ShapeFile
This feature is very beta. Most datatypes are converted to strings and Z and M values are stripped.
Note that if you have a mix of points, multipoints, lines and polygons in
your resultset, up to four sets of shapefiles will be created.
Screenshots
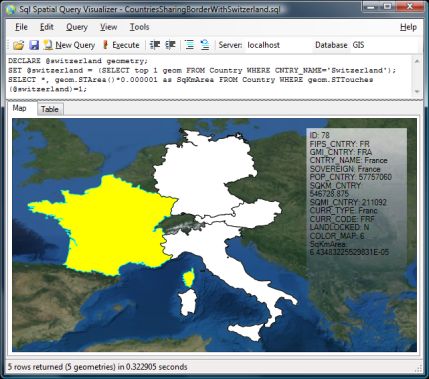
Countries sharing border with Switzerland
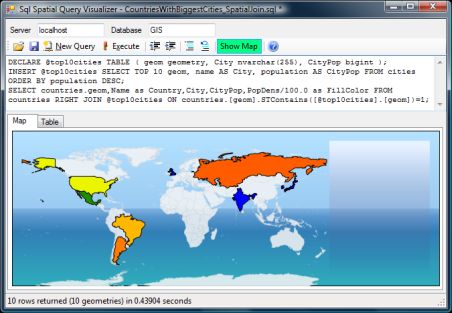
Spatial join: Countries that contain the worlds 10 largest cities
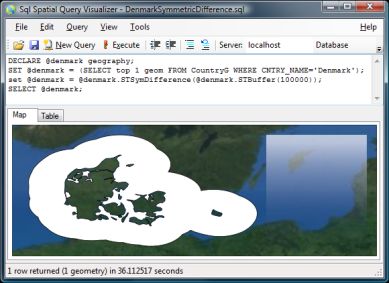
Area within 100km of Denmark
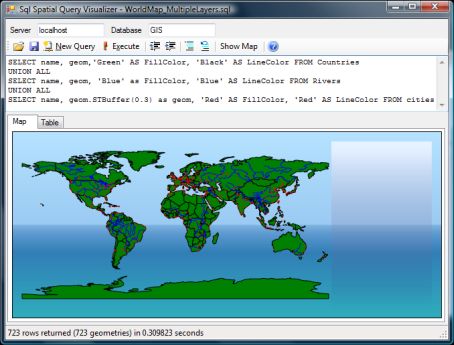
Merging multiple queries to generate a combined map
Back to download page